
Table of Contents
The immediate problem
Temperatures rise and records stay blank; that is the reality many operators face. Fleets using van fleet management systems often find telemetry gaps, and integrated platforms for fleet and delivery management are left to patchwork manual processes. In Nairobi, frequent short stops and mixed-load runs expose perishable consignments to unseen excursions that later show up as customer complaints or failed audits. This piece sets out the precise, problem-driven data points you must collect and the reporting practices that prevent spoilage and non-compliance.

Core metrics to collect continuously
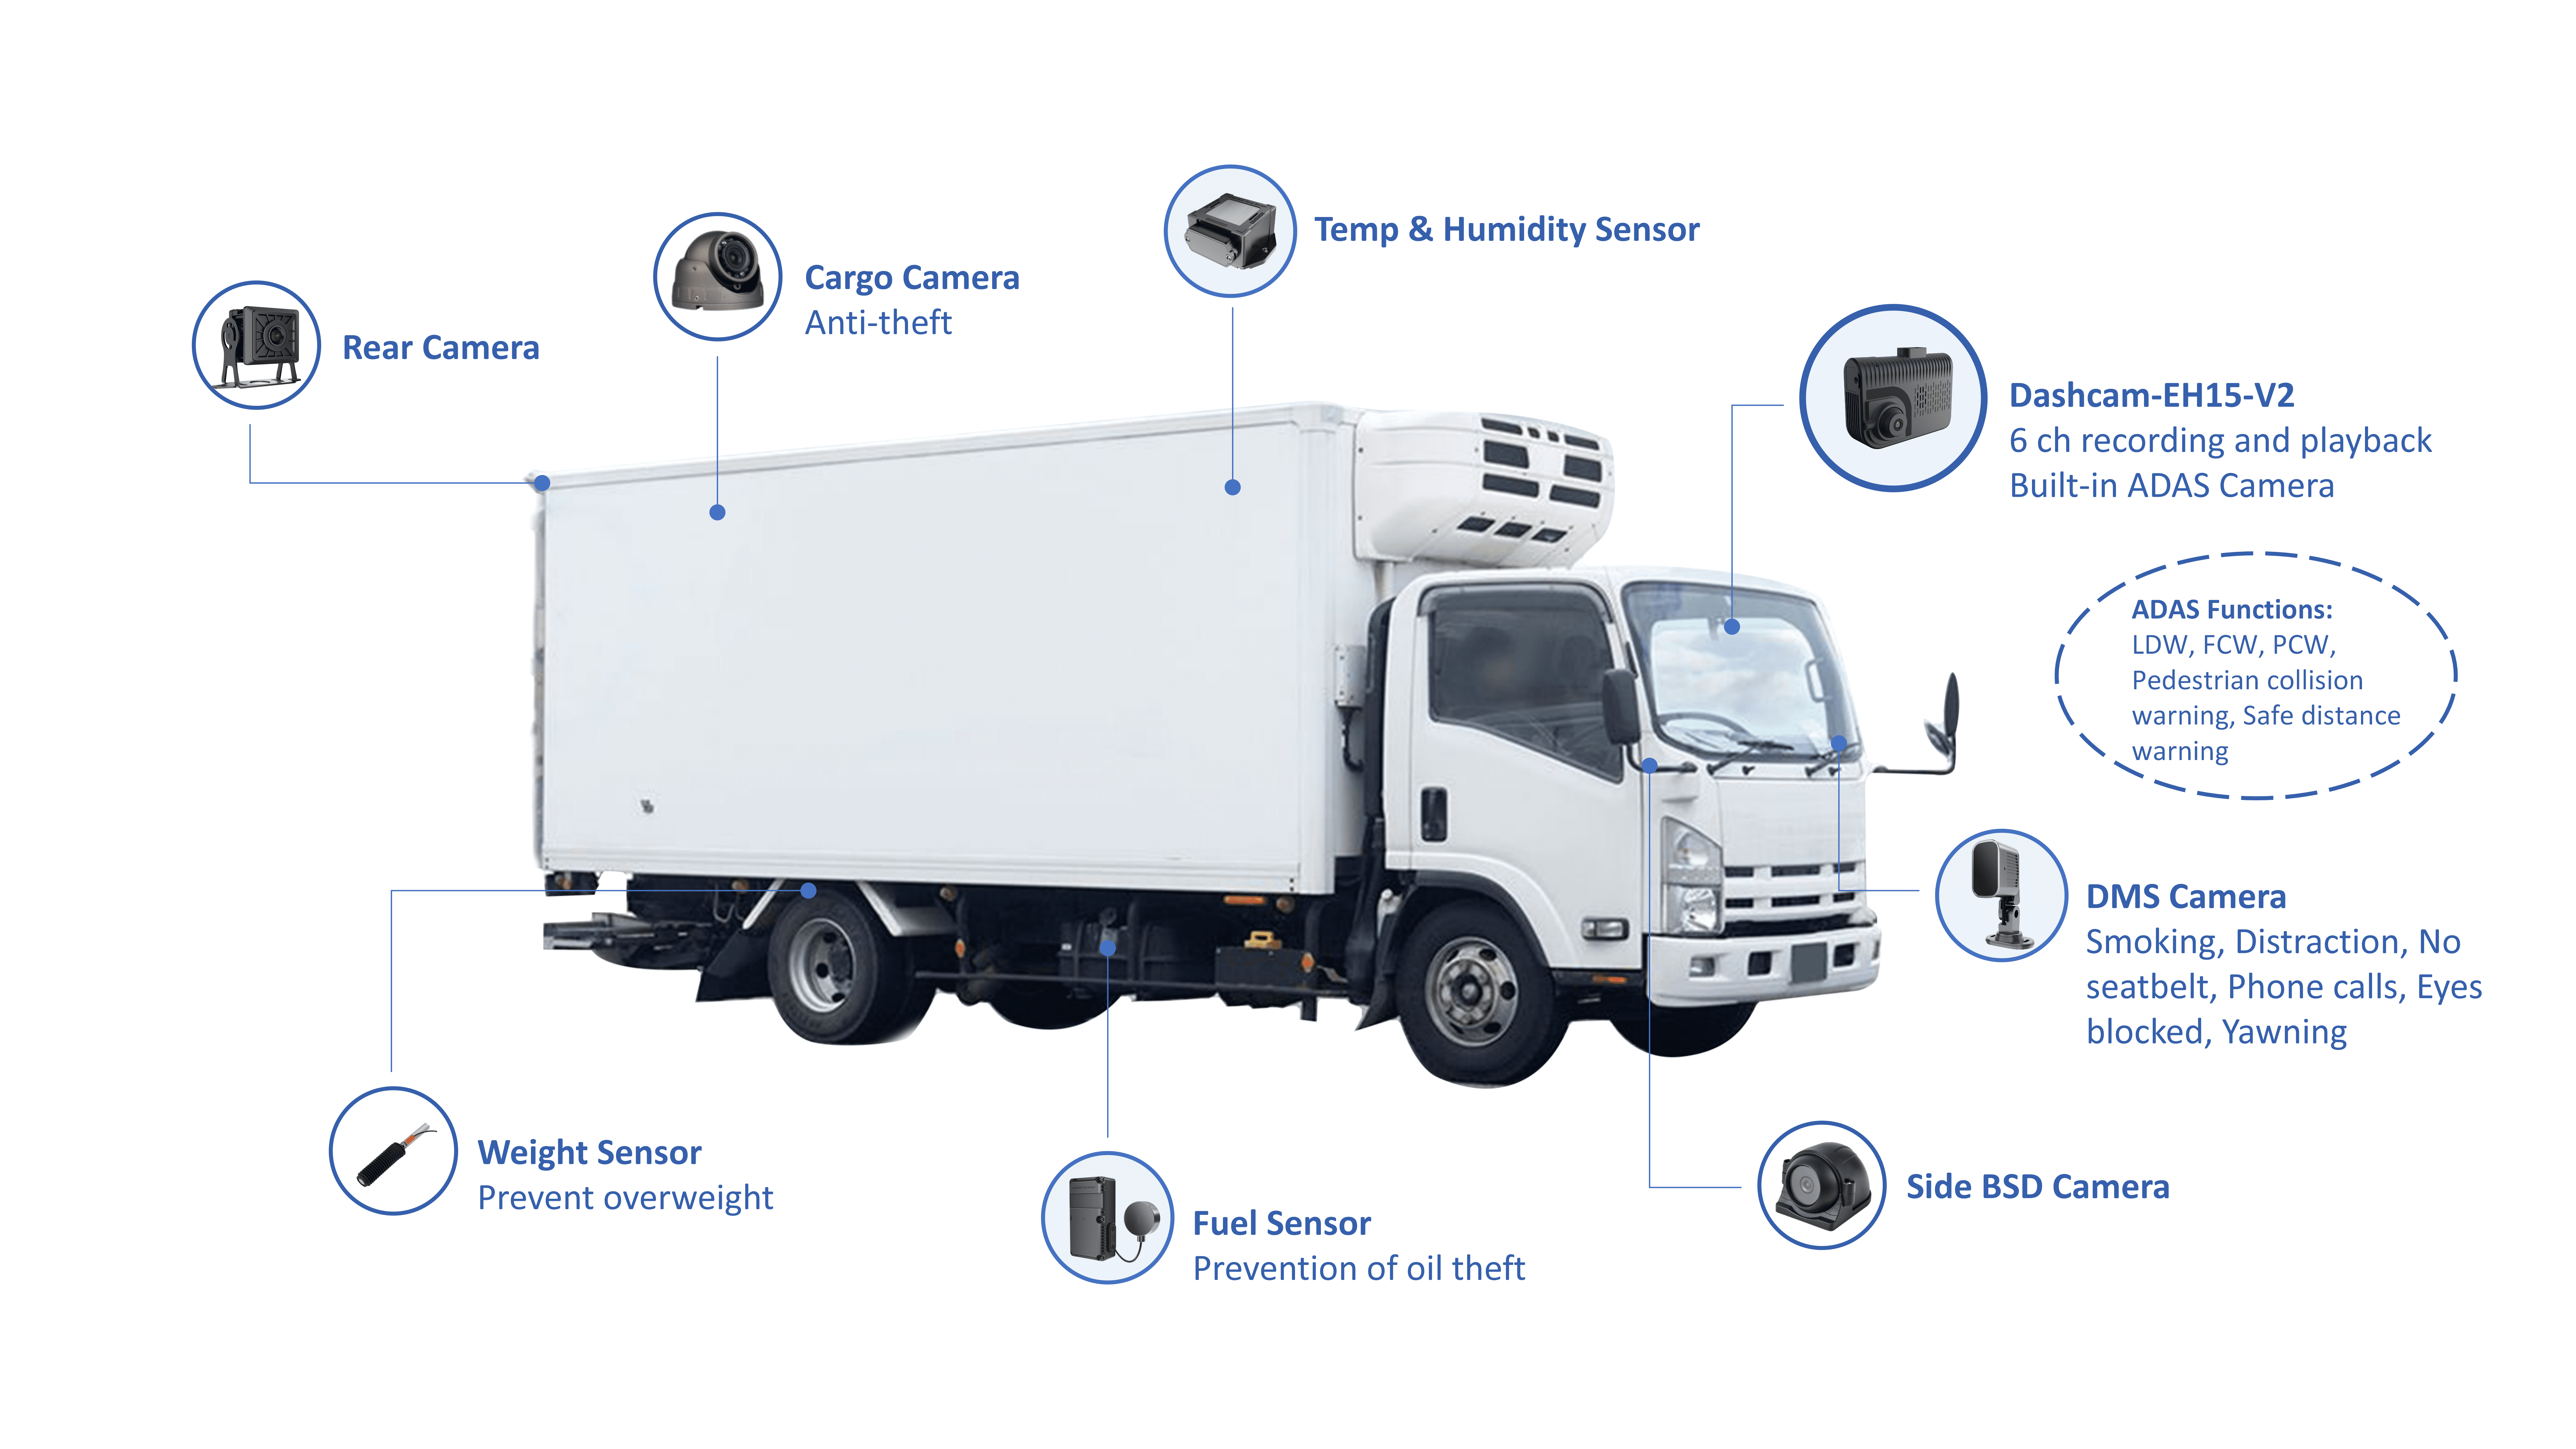
Collect only what affects product safety and operational decisions. Prioritise these metrics:- Internal temperature: timestamped, sensor-level readings every 1–5 minutes for critical loads.- Setpoint vs actual: refrigeration setpoint and any deviation events.- Door open/close events: time and duration tagged to load compartments.- Power/auxiliary power state: battery and generator status for trailers and vans.- GPS trace and geo-fence events: position plus time-in-location to detect unscheduled stops.- Idle time and engine-on hours: correlate with refrigeration performance and fuel use.- Fuel consumption or battery draw: for cost and range planning.- Driver actions and hand-offs: who opened a door, when the cargo was handed over.- Maintenance and calibration logs: last sensor calibration, last refrigeration service.Collect raw data at the point of capture; keep validated aggregates for dashboards.
How each metric fixes real problems
Every metric answers a direct operational question:- Temperature readings show whether product met its required limit during the whole trip.- Door events explain sudden temperature spikes and identify training needs.- Geo-fence and GPS reveal whether delays are route-related or hand-off related.- Power-state data finds failed batteries before a full excursion happens.Reports built from these metrics let inspectors and claims teams reproduce the delivery timeline instead of relying on recollection.

Reporting you need and why
Design reports around exception, evidence and trend:- Exception report (real-time): alerts on excursions, door-open beyond threshold, or loss of power.- Evidence pack (post-trip): signed temperature timeline, door events, GPS log and maintenance stamp.- Trend report (weekly/monthly): average excursion minutes, repeat hotspot locations, vehicle-level reliability.Keep reports simple for operational staff and exportable in audit-friendly formats for quality teams. Timestamp precision and immutable logs are essential for trust.
Common pitfalls and how to avoid them
Avoid these mistakes:- Too many metrics: focus on actionable signals; extra noise hides excursions.- Low-frequency polling: coarse samples miss short but dangerous excursions.- Uncalibrated sensors: false confidence from drifting sensors leads to product loss.- Manual reconciliation: human transcription introduces error and delay.Remedies are direct: set sampling rules, schedule sensor calibration, automate ingestion and validation, and enforce a single source of truth for audit data.
Practical rollout steps for minimal disruption
Follow a phase plan that delivers immediate value:1) Pilot: pick a high-risk route and fit sensors and telematics for a small set of vans. 2) Define KPIs: select excursion minutes, door-event counts and on-time delivery rate for that pilot. 3) Validate: run parallel manual logs for two weeks to verify sensor accuracy. 4) Automate alerts: route exceptions to on-duty supervisors with clear action steps. 5) Scale: standardise device procurement, calibration cadence and report templates before wider rollout. Train drivers on the ‘why’ for each alert; clear SOPs reduce repeat incidents.
Data governance and retention
Store raw, tamper-evident logs for the period required by your regulators and contracts. Keep validated summaries for business intelligence and shorter-term operational use. Define access by role: drivers see current-trip alerts, supervisors see exceptions, quality teams pull evidence packs. Regular audits of sensor integrity and log completeness prevent surprises during inspections.
Closing synthesis
Fixing cold chain failures starts with focused data that maps directly to decisions: detect, explain and prove. When you track a tight set of metrics, enforce calibration and design reports for exceptions and evidence, the number of spoilage incidents drops and audit responses become straightforward. Field teams who adopted these steps find clearer root causes and faster corrective action, and that practical alignment is what partners such as BSJ bring to fleet operations without fuss or theatrical promises.